Melting glaciers, shrinking polar ice and
rising oceans?
And the receding glaciers on Earth, that are in
accelerating retreat all over? The melting polar ice caps? The rising sea
levels?
Well, first of all, the sea levels are not rising.
The mean sea level was established and marked in 1841 at the Isle of the
Dead, in Port Arthur, Tasmania, Australia. There has been no rise in the sea level
since then, at best only a very small rise, no more than 1.6 cm or just a little less than
two-thirds of an inch during all of the last century. A good case is being made for
the claim that during the total interval since 1841 the mean sea level even fell a
little. John L. Daly (deceased), science advisor to the Greening Earth Society, resided in
Tasmania and investigated the history of the mean-sea-level marker there:
Recent publicity arising from a study
by the Universities of Southampton and Tasmania
[1] of an old sea level
benchmark at Port Arthur, Tasmania, claims `dramatic' sea level rise of
about 13cm since the mark was first struck back in 1841.
These claims are
based primarily on statistical probability models and are
unsupportable when viewed in the context of other physical
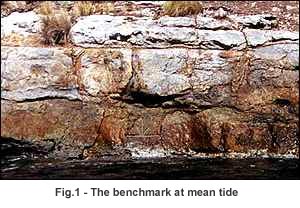 and
documentary evidence available surrounding the benchmark. The
study claims the benchmark was originally set 44.5cm above the
mean level of the sea (as it then existed in
1841). Since it now sits at 31.5 cm above
(see fig.1), the difference - 13cm -
is claimed to be evidence of sea level rise. and
documentary evidence available surrounding the benchmark. The
study claims the benchmark was originally set 44.5cm above the
mean level of the sea (as it then existed in
1841). Since it now sits at 31.5 cm above
(see fig.1), the difference - 13cm -
is claimed to be evidence of sea level rise.
However, the man responsible for putting the
mark there, explorer Sir James Clark Ross stated explicitly and several times in his 1846 book
[3] that the mark was placed
at MSL (as he estimated it to be), not at a
point 44.5cm above, near the high tide point, as claimed by the study.
Other evidence surrounding the original placing of the benchmark is less
clear, but we do have one positive measurement of where the benchmark
stood relative to sea level taken in 1888 by the then Government
meteorologist, Commander J. Shortt R.N. He found the mark to be 34cm
above sea level - only 2½ cm different to its current position
[7] [5].
This suggests a sea level rise since 1888 of only 2½cm, not 13cm as
claimed by the study. This small rise of 2½ cm is fully consistent with
a survey of long-term tide gauges [15]
around the Australian coast carried out recently by the National Tidal
Facility in Adelaide, which found a sea level rise rate of only 0.3
mm/yr, equivalent to a sea level rise of 3cm over a century. Even the
current sea level in the inner cove (Mason Cove)
of Port Arthur itself is lower than that indicated by a tide gauge
[6] which the study claims
existed there in the early 1840s....12
What John Daly argued is true of the oceans in the
southern hemisphere, is true of the findings by many climatologists who
studied measurements of trends in sea levels all over the globe.
Sea
Level (Difficulties Predicting Change)
By the Center for the Study of Carbon
Dioxide and Global Change
(2003 10 01 )
Summary: Climate alarmists are quick to make dramatic predictions of
catastrophic increases in sea level, which they attribute to CO2-induced
global warming. A brief review of the pertinent scientific literature,
however, suggests that seasoned researchers in the field are nowhere
near as sure of themselves on this important point. (Full
Story)
In support of those reports on the lack of
sea-level rise and their refutations of catastrophic global flooding due
to global warming, Dr. Nils-Axel Mörner, Paleogeophysics & Geodynamics,
Stockholm University, S-10691 Stockholm, Sweden, provides irrefutable
evidence from the Indian Ocean:
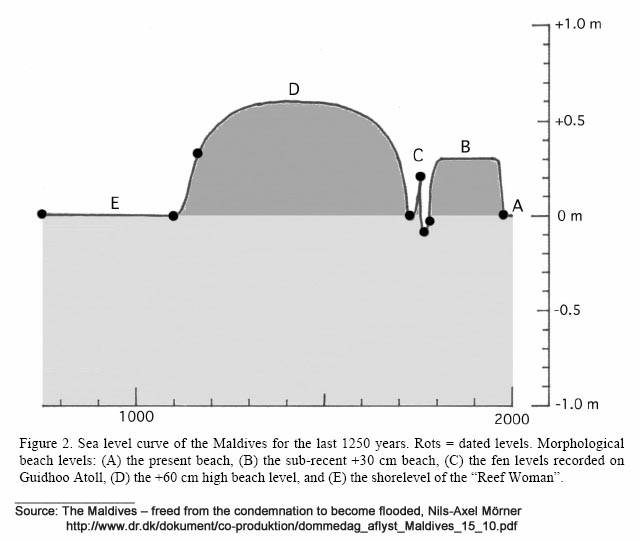
The Maldives – freed from the condemnation to
become flooded
Abstract
We have studied the past and present sea level changes on the
Maldives in great details. This gives prospects also for the near
future. The people of the Maldives have, in the past, survived a
higher sea level by about 50–60 cm. The present trend lacks signs of
any sea level rise. On the contrary, firm observational facts record
a sea level fall in the last 30 years. This sea level fall is likely
to be the effect of an increased evaporation and intensified
NE-monsoon over the central Indian Ocean. Most important, we can now
free the people from the threat and condemnation to become flooded
in the near-future.
(Full
Paper, 586 kB PDF file)
And as to the retreating glaciers, according to Dr.
Landscheidt, the World Glacier Monitoring Network in Zurich identifies that
"presently 55% of the glaciers in high latitudes are advancing
compared with 5% around 1950."13
In the summer of 2002, one of my nieces and her family came to
visit, the first time since 1972. She commented on how much impact global warming
had had on the Athabasca Glacier at the Columbia Ice Fields since 1972.
The Athabasca Glacier had
retreated quite a bit since 1972. I mentioned that the advance or retreat of a given
glacier is nothing more than a reflection of the climate in a relatively small, local area
but not of global warming or cooling. For an accurate assessment on
a global level we would have to look at the changing
conditions of all glaciers in the world.
The Hubbard Glacier, not too far from the Columbia Ice Fields, at the
Pacific, right at the border between Alaska and Canada, at Yakutat Bay, Alaska, is
presently in rapid advance, just as it was in 1985. If we were to
extrapolate from that — as my niece did from the retreat of the Athabasca
Glacier — to the whole world, we would have a dilemma. Which
extrapolation would be the correct one, the one made from the Athabasca
Glacier or the one made from the Hubbard Glacier? Have a look at the Landsat
images of Yakutat Bay dated Aug. 7, 1985 and Sep. 11, 1986.
Hubbard Glacier, Alaska
1985, 1986
These images show
the vicinity
of Yakutat Bay, Alaska. Russell Fiord is the narrow body of saltwater connected to
the bay and extending
southeast. The Hubbard Glacier lies
where Russell Fiord meets
the bay.
In May 1986, the Hubbard Glacier surged down from the mountains,
blocking the outlet
of Russell Fiord and creating "Russell Lake". All that summer the new lake
filled with runoff; its water level rose 25 meters, and the decrease in salinity
threatened its sea life.
Around midnight on October 8th the dam began to give way. In the next 24 hours an
estimated 5.3 billion cubic meters of water gushed through the gap, and the fiord was
reconnected to the ocean at its previous level.
The fiord could become dammed again, and perhaps permanently. If this happens, the
fiord could overflow its southern banks and drain through the Situk River instead,
threatening
trout habitat
and a local airport.
(Full Story) |
Sure enough, it didn't take long and the Hubbard Glacier
advanced once more, rapidly, in 2002.
| Anchorage Daily News Hubbard
Glacier chokes channel
Daily News Staff
(Published: June 29, 2002)
Advancing Hubbard
Glacier has narrowed the channel into Russell Fiord to less than the width of a basketball
court, Tongass National Forest officials said Friday. (Full Story) |
The Anchorage Daily News
indicated in the article identified just above that "Current information and
photographs of Hubbard can be found at the Tongass National Forest Web page (www.fs.fed.us/r10/tongass/). Click on
the 'What's
New' link."
Is it possible that the citizens of Yakutat Bay feel threatened by the effects
of global "warming"? Of course not! They are
worried about their immediate local problem, not about long-term trends in
global climate change. However, their local problem is no more
representative of global climate change than is the slow retreat apparent
at the Athabasca Glacier. Moreover, both of those local problems are
at opposite ends of the range of concerns employed by climate alarmists.
If we average things out between those two glaciers out of many thousands
in the world, then the conclusion is that the average growth of glaciers
is still quite considerable and should be taken as evidence of global
cooling. That would be another mistake. The study sample of
two glaciers is too small to permit valid conclusions as to a relationship
between their average rate of growth and global climate trends.
Moreover, those two glaciers are not even representative of the many
thousands of glaciers in the world. Both, the Hubbard and the
Athabasca glaciers, are located on the west side of North America, just a
few hundred miles apart from one another.
Update 2011 06 13:
Robert Felix has a detailed update of the current status of the
Hubbard Glacier. He summarizes his update by stating,
"The largest tidewater glacier in North America
is advancing 10 feet (3.1 meters) per day. At that rate it could
close Russell Fjord this summer. And not a peep from the
main-stream media...." (Full
Story)
Let's consider exhaustive and in-depth
studies of northern glaciers. The Center for the Study of Carbon Dioxide and Global
Change reports that the northern glaciers in the world that should, according to the
climate alarmists, be in rapid melt-down, do nothing of the sort. Especially during
the past few decades some of them have been advancing and others exhibit a marked slowing
down of the rate at which they had been retreating during the first half of the 20th
century.
Taken together, these observations from high northern latitudes, where CO2-induced global warming is supposed to be most evident, provide no
evidence for that dreaded phenomenon. In fact, they suggest that nothing out of the
ordinary is occurring at all. Hence, we once again have a situation where the
predictions of today's best climate models fail to conform to reality.
—Center for the Study of
Carbon Dioxide and Global Change
The summary from which that quote was taken contains links to additional
summaries of studies of northern regions of glaciation or of specific glaciers:
-
In a review of "the most current and comprehensive research of
Holocene glaciation," along the northernmost Gulf of Alaska between the Kenai
Peninsula and Yakutat Bay,
Calkin
et al. (2001) report there were several periods of glacial advance and retreat
over the past 7000 years. ...
-
Subsequent to this time [the last half of the 19th century], as
the planet emerged from the depths of the Little Ice Age, the mass balance records of the
18 Arctic glaciers with the longest observational histories were studied by
Dowdeswell
et al. (1997). ...."ice-core
records from the Canadian High Arctic islands indicate that the generally negative glacier
mass balances observed over the past 50 years [when the vast majority of the CO2 resulting from human activities entered the atmosphere] have probably
been typical of Arctic glaciers since the end of the Little Ice Age [our
italics]," when the magnitude of anthropogenic CO2 emissions
was a whole lot less than it has been from 1950 onward.
-
Additional evidence that the Arctic's glaciers are not responding to
human-induced warming comes from the studies of
Zeeberg and Forman (2001)
and Mackintosh
et al.
(2002), who indicate there has been an expansion of glaciers in the European
Arctic over the past few decades.
-
Other glacier observations that run counter to climate model predictions
are discussed by
Mackintosh
et
al. (2002), who concentrated on the 300-year history of the Solheimajokull outlet
glacier on the southern coast of Iceland. In 1705, this glacier had a length of
about 14.8 km; and by 1740 it had grown to 15.2 km in length. Thereafter, it began
to retreat, reaching a minimum length of 13.2 km in 1783. Rebounding rapidly,
however, the glacier returned to its 1705 position by 1794; and by 1820 it equaled its
1740 length. This maximum length was maintained for the next half-century, after
which the glacier began a slow retreat that continued to about 1932, when its length was
approximately 14.75 km. Then it wasted away more rapidly, reaching a second
minimum-length value of approximately 13.8 km about 1970, whereupon it began to
rapidly
expand, growing to 14.3 km by 1995.
Spiegel Online; English Site
May 23, 2005
THE COMING AND GOING OF GLACIERS
A New Alpine Melt Theory
By Hilmar Schmundt
The Alpine glaciers are shrinking, that much we know. But new
research suggests that in the time of the Roman Empire, they were
smaller than today. And 7,000 years ago they probably weren't around
at all. A group of climatologists have come up with a controversial
new theory on how the Alps must have looked over the ages...
....He digs into the ground with his mountain boot until something
dark appears: an old tree trunk, covered in ice, polished by water
and almost black with humidity. "And here is the proof," says Joerin.
Radical new theory
The tree trunk in the ice is part of a huge climatic puzzle that
Joerin is analyzing for his doctoral thesis for the Institute for
Geological Science at the University of Bern. And he is coming to an
astonishing conclusion. The fact that the Alpine glaciers are
melting right now appears to be part of regular cycle in which snow
and ice have been coming and going for thousands of years. (Full
Story)
___________________
See also:
Archaeological Finds in Retreating Swiss Glacier , Steve
McIntyre, posted on Nov 18, 2005 at 10:59 PM
Is the Greenland ice
really melting, as the climate alarmists would have us believe?
It has done so before, and quite likely it will do it again, but no
one knows whether that will be due to man-made global warming. It
certainly was not man-made global warming that caused Greenland to be
largely (perhaps completely) ice-free, at least once before. That
was not due to the relatively trivial melting during the medieval
warming period from about 800 AD to 1100 AD, when the Vikings colonized
the southern shores of Greenland and farmed there until the onset of the
Little Ice Age (which ended in about 1850) caused those colonies to
perish.
A Danish DNA researcher found 450,000 to 800,000 year-old DNA in ice
cores from the bottom of samples taken in Greenland. The samples
provided DNA stemming from "coniferous trees, butterflies, beetles, and
a variety of other boreal forest plants".
[Willerslev's] team identified and dated genetic sequences from
coniferous trees, butterflies, beetles, and a variety of other
boreal forest plants--traces of ancient forests that Willerslev says
covered southern Greenland perhaps as far back as 800,000 years ago.
...climatologists have relied on models to argue that southern
Greenland was free of ice--and open to plant growth--during the
Eemian, or last interglacial period, some 130,000 to 116,000 years
ago. The new results contradict that scenario: An ice-free Eemian in
Greenland would have replaced the 450,000- to 800,000-year-old
forest DNA Willerslev found in the bottom ice cores with younger
plant and animal DNA. The survival of 450,000-year-old DNA suggests
that the ice has been around much longer than previously thought. If
southern Greenland remained ice-covered during the last interglacial
period, it could mean global warming would have to get much worse
before it completely melts away the Greenland ice sheet. (Source:
ESKE WILLERSLEV: Ancient DNA's Intrepid Explorer, Science,
2007 07 06. p. 36 - 37)
For Eske Willerslev's full report (many others participated in
producing it) in Science, see:
Ancient Biomolecules from Deep Ice Cores Reveal a Forested Southern
Greenland.
Sea Ice
If the hypothesis of man-made global
warming were true, then the sea would be warming up, and the Arctic sea ice would be
shrinking. Some newspapers reported that the Arctic sea ice is indeed doing
that.
It is most definitely true that the area covered by Arctic sea ice shrinks. It does
that every year during the summer months – and during the winter it grows
again. The area covered by Arctic sea ice more than doubles each year from its
smallest expanse in summer to its largest expanse in winter. The question is whether
a long-term trend of the size of the relative area covered is super-imposed on the annual
oscillation in the size of the area covered by Arctic sea ice.
It would be neither practical nor even possible to send teams of
surveyors to the Arctic to take measurements sufficiently often and to be
able to determine with a
sufficient
degree of accuracy whether the shifting and drifting Arctic sea
ice is experiencing a long-term trend in change of size. However, the advent of satellites
and computers made it possible to do what could not be done with traditional
methods. Regular, relatively accurate measurements of the area covered by the Arctic sea ice
have been made, covering the interval from 1978 to now. However, as
is illustrated farther down on this page, measuring the extent of arctic
sea ice is not easy, and estimating its extent is even more difficult,
especially when it comes to projecting trends into the future, given
that estimates about its current extent substantially differ from what
has been measured.
If we were to assume that the trend exhibited by changes to the Arctic
sea ice for the interval from November 1978 to December 1998 would hold true for the
future, then it would seem that by about 2320 the Arctic will be totally free of sea ice,
at least during the summer. Is that a reasonable assumption? That depends on a
number of things, first and foremost of which is the requirement that the Arctic air
temperatures are truly warming up and that whatever else caused the arctic sea ice to
shrink during the 20 year interval will continue to have the same effect to the same
extent. That would require quite a stretch of the imagination. For one thing,
surface temperature measurements taken at
weather stations around and in
the area of the Arctic Ocean show no indication at all that a warming trend is at
work. That leaves the examination of other factors and the search for what they may
be.
A group of Canadian scientists (CRYSYS)
used the same data displayed in the graph from NASA shown above (all of the data used for
such purposes comes from the same satellite measurements), added data from observations of
sea ice extent made from ships during the time prior to when satellite measurements took
place, massaged it using modelling, and postulates that within a hundred years or so there
will be no Arctic sea ice left or perhaps just a little bit during the winter.
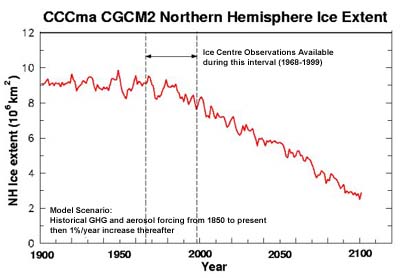
Source:
CRYSYS
Would it be correct to suppose that the melting of the Arctic sea ice
will prove to be a boon to Canada's tourist industry? Think of the thousands of
miles of pristine beaches available that would then be accessible to vacationers from all
over the world!
Unfortunately, CRYSYS' prediction is troubled by a few problems. It will only come
to pass if all of the assumptions they used in their modelling are correct. Sadly,
the researchers at CRYSYS did not put any confidence limits on their prediction, so that we
cannot be sure how accurate they feel it may be and how likely it is to come to pass.
Furthermore, they do not appear to offer any predictions for other and probably
more realistic scenarios. For one thing, the key factor in their assumptions, namely
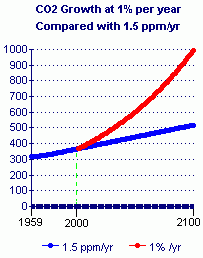
that "green house gases" (GHG) will increase at a rate of one percent per year,
is wrong. CO2 in the atmosphere presently increases at a linear rate of
1.5 ppm/year and not at an exponential rate of one percent per year. The difference
between the real rate of increase and the rate assumed by CRYSYS is over
time quite substantial.
Source: The "National Assessment" Overview:
Politics Disguised
as Science
By John L. Daly, Greening Earth Society Science Advisor
It stands to reason that a climate prediction for the next 100 years that
is based on data represented by the red line in the preceding graph would be
wide off the mark.
The following graph shows the growth of atmospheric CO2
content on an objective and realistic scale.
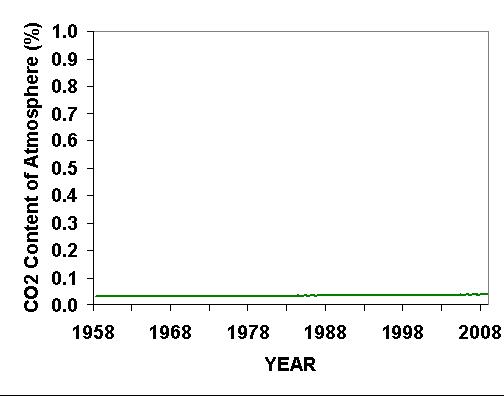
The web page by
Dr. Roy Spencer, from which the preceding graph has been copied,
provides the following explanation for that graph:
BUT WE CAN’T KEEP PUMPING CO2 INTO THE
ATMOSPHERE FOREVER, CAN WE?
No…and we won’t. But the amount of CO2 we put into the atmosphere is
pretty trivial: As of 2009, there are only 38 or 39 molecules of CO2
for every 100,000 molecules of atmosphere, and it will take
mankind’s CO2 emissions another five years to raise that total by 1
molecule, to 40 out of every 100,000 molecules. The following graph
[identified as per the preceding graph -- WHS] shows how much
the CO2 content of the atmosphere has risen in the last 50 years at
Mauna Loa,
Hawaii. The graph has a vertical scale that only extends to 1% of
the atmosphere, and as can be seen, the increase in CO2 is barely
visible. This graph is not a trick…it looks different from what you
are used to seeing because CO2 is usually plotted with a greatly
magnified vertical scale to make the CO2 rise look more dramatic.
Yes, we might double the CO2 concentration of the atmosphere by late
in this century…but 2 times a very small number is still a very
small number.
Then, too, it seems to be necessary as well to consider that the Arctic sea-ice extent
forecasted by CRYSYS for the years 1999-2002 is not born out by reality.
As their very own depiction of the latest data shows, the arctic sea ice
area increased during the last two of the last three years. Those data
were apparently not used in their model, which makes the prediction
extracted from their modelling efforts nothing more than the product of
advocacy research.
Advocacy research is research in the guise of science
that selectively chooses data points that support a hypothesis to be
"tested" and discards or modifies those data points that tend to
disprove a given pet theory.
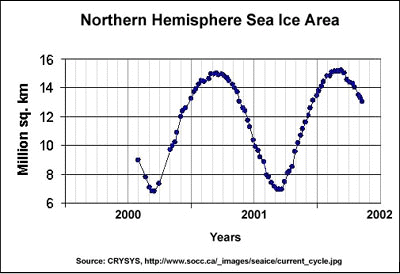
Given that the area covered by arctic sea ice did increase by a small
amount during the 2000-2002 interval, claims that the polar ice is melting because the
ocean is heating up due to man-made global warming must be taken with a bit more than just
a grain of salt. It seems doubtful that CRYSYS can be doing objective research.
It would not be surprising at all if their research is politically oriented.
After all, their funding and some of their team members come from the same source that
pushes for increased taxation and for global income equalization through income transfers
to less developed nations by means of implementing the Kyoto accord. It seems that
is was ideological fervor that made the CRYSYS team choose their somewhat propagandistic acronym for
their organization.
However, in addition to the false assumption as to the trends in CO2
content of the atmosphere, there is another flaw that is illustrated in the trend in the
Arctic sea ice extent shown by CRYSYS. It doesn't measure up to reality.
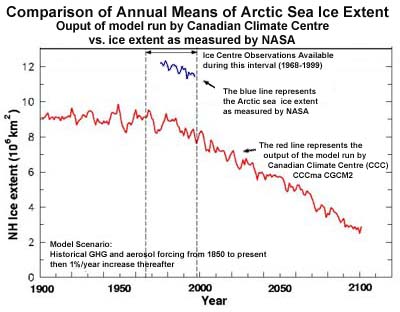
Sources: CCC model run as per
CRYSYS
Annual means of Arctic sea ice extent derived from
data by NASA
(Nimbus 7 SMMR and DMSP SSM/I data sets with the NASA Team sea ice algorithm)
If the calculation by a climate model of what the climate ought to have
been is so wide off the mark, what is the chance that the model's prediction of future
trends is anywhere close to being accurate? It would have been possible for CRYSYS
to show the deviation of the model run's prediction from reality, but CRYSYS did not.
Instead, CRYSYS appears to have worded their comments in the graph showing the
model-run output to mislead.
The results reported in "Historical GHG and aerosol forcing
from 1850 to present" are not representative of historical ice extent.
They are
results of calculations by the model run of what historical Arctic sea ice extent ought to
have been according to what the Canadian Climate Centre wishes for. Why did CRYSYS
not also show what the Arctic sea ice extent actually was? From what CRYSYS'
performance is in that regard it would seem that Canadians are hardly getting much value
for their tax dollars devoted to the funding of CRYSYS.
Here now is the full and objective truth in relation to sea-ice extent.
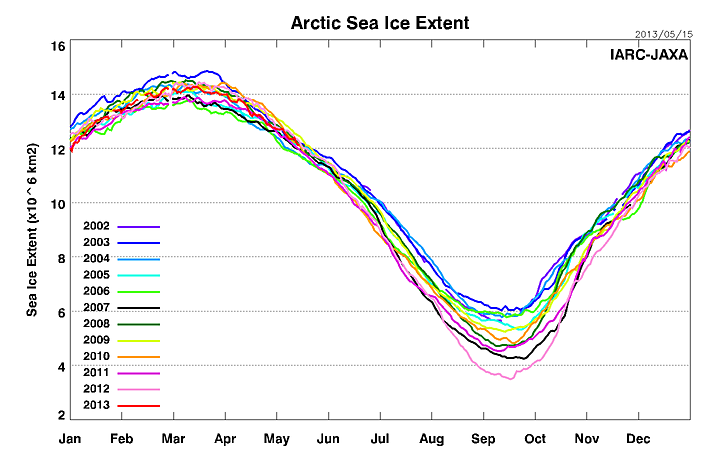
Arctic sea ice extent
(1979 - 2009 and later):
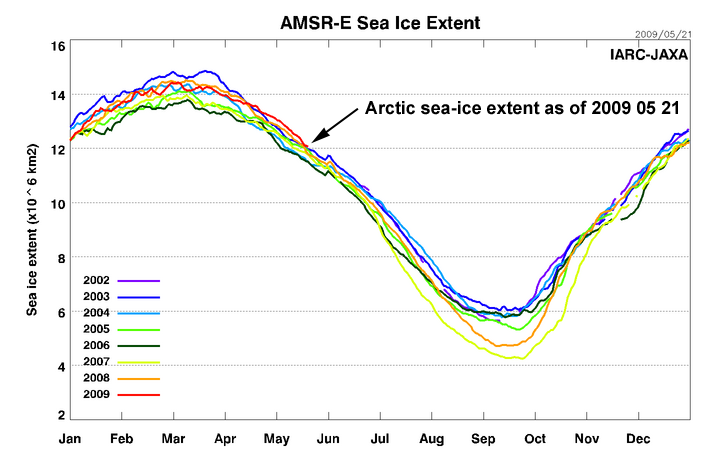
Updated daily (click on
this link to see latest graph)
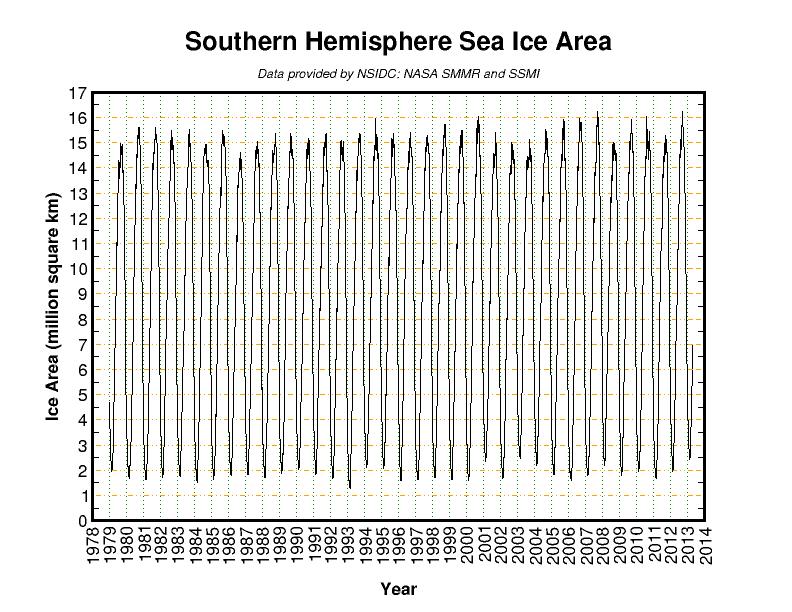
Antarctic sea ice extent (1979 - 2009 and later):
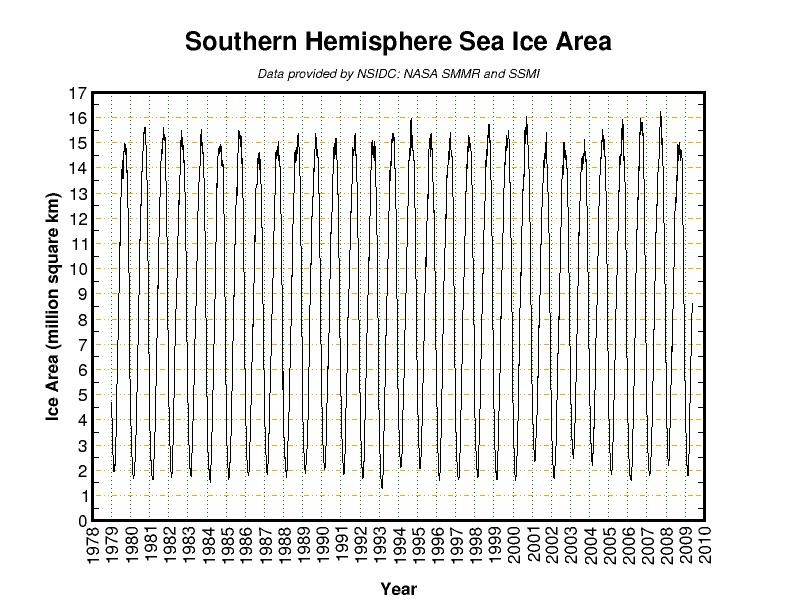
Latest version
Other researchers seem to be driven to a somewhat lesser extent by
ideology. They still have the capability to be skeptical of some of the projections
shown by the various General Circulation Models and the data that goes into them:
7.1.2
The passive microwave sea
ice concentration record - how reliable is it?
The recent digitization of Canadian and US sea ice
charts has produced an easily accessible and valuable record of sea ice conditions over
the northern hemisphere over the last 30-years. An analysis of ice type of
information that can be obtained is shown. One interesting result is that the East
Coast of Canada has the highest proportion of new and young sea ice types of any Canadian
region. This is related to the sea ice regime on the East Coast where sea ice
advances unconstrained on its eastern and southern edge opening up the sea ice cover and
accelerating surface sea ice formation. This record is compared to the passive
microwave sea ice concentration record over the last 20 years. Results of the comparison
using the NASA Team algorithm over the 1979 to 1996 period demonstrates the consistency
with which sea ice concentration and sea ice area is underestimated during summer melt and
fall freeze-up conditions. This underestimation is considerably larger than previous
comparisons using satellite remotely sensed data.
Minutes of the Twelfth
Annual Meeting of the Participants of the International Arctic Buoy Programme (IABP)
Hosted by Marine Environmental Data Service (MEDS)
Ottawa, CANADA, 10 – 12 June 2002
The problem affecting the accuracy of estimates of sea
ice extent based on satellite measurements (areas covered by melt water on top of ice
floes are presently not recognized as part of the Arctic sea ice area) is being addressed.
As per NASA:
A pre-launch Arctic
campaign called Meltpond2000 (Cavalieri, 2000) took place from June 25 through July 6,
2000 with the objective of quantifying the errors incurred by the AMSR-E sea ice
algorithms resulting from the presence of melt ponds. Melt ponds are currently the largest
single source of error in the determination of Arctic sea ice concentrations with
satellite passive microwave sensors.
AMSR-E Sea Ice Validation
Melt ponds are vast and numerous expanses of water that floats on top of
arctic sea-ice fields during periods of melting. They constitute a
considerable proportion of the surface of arctic sea ice during the
summer. They pose a problem with the accuracy of satellite
measurements of the sea-ice expanse, as they obscure the underlying ice
and prevent the accurate measuring of the true sea-ice expanse. Of
no lesser importance is the note of caution expressed in the following.
Interannual variability in extent is large: for
example, a record minimum in September of 1995 was followed by very high extent the next
year. Globally, the annual variation of sea ice area is about 37% of the mean (Gloersen et
al. 1999). Because of this, it is difficult to infer long-term trends from short
observational records, or to deduce the influence of possible natural oscillations in ice
extent.
The National Snow & Ice Data Center —
Sea Ice Index
That "it is difficult to infer long-term trends from short
observational records, or to deduce the influence of possible natural oscillations in ice
extent" may be an understatement. It seems that it would have been more
accurate to state that it is not only difficult to do so, but that at the present state of
climate science not enough is known to permit making predictions of long-term trends with
an acceptable degree of certainty.
Of course, from data covering not quite a two-year
interval not much can be told about long-term trends. Not much more can be told from
data pertaining to intervals spanning 22 years or 80 years when it comes to predicting
long-term climate trends. Even if the Arctic sea ice diminished a little during an
upturn in the climate cycle, that is not proof that the Arctic is warming, especially not
if temperature measurements say otherwise. In the absence of large-scale global
warming, there must be something else at work.
Other climatologists involved in examining Arctic sea ice found evidence that wind exerts
a large influence on the extent of the Arctic sea ice, e. g.: Robert Ezraty and Alain
Cavanié:
It so
happens that, globally, the MY [multi-year]
ice area at the beginning of winter 1991 is almost identical to that of the beginning of
winter 2001. A likely explanation for this sudden increase might be the occurrence of a
cyclonic wind circulation in late spring-beginning of summer 1996 (figure 3) which
inhibits and reverses the anti-cyclonic ice circulation, strongly reducing the MY sea ice
export, in summer, through Fram Strait and resulting in sea ice accumulation in the Arctic
basin (Proshutinsky and Johnson, 1997). Although less pronounced, a similar MY ice area
increase occurred for winter 1992-1993. According to Proshutinsky and Johnson, 1997, a
typical sea ice cyclonic circulation occurred during summer 1992 (see their figures 17a to
17d). (Robert Ezraty and Alain Cavanié)
Conversely, it would stand to reason that occurrences of
the absence of cyclonic wind circulation in the spring and summer of any year will
increase the sea ice export through the Fram Strait (southward past the east coast of
Greenland).
Others found that the main cause for the downward trend in
the thickness, extent and area of the Arctic sea ice cover north of Alaska is a
combination of temperatures, wind and amount of precipitation. They found that a
combination of relatively moderate temperatures and low amounts of precipitation cause
more ice to grow than does a combination of low temperatures and large amounts of
precipitation. (R.S. Stone et al.)
They found that the annual onset of snow melt generally advanced by
about 8 days during the interval from 1965 to 2000, but their data also
indicate that during the last five years the onset of snow melt steeply
increased by about that many days.
A key finding that emerged from the
model intercomparison [of General Circulation Models] is that the across-model
variance of most near-surface variables is larger in the Arctic than in any other part of
the Northern Hemisphere. This across-model variance is greater than the changes projected
by most models for a CO2-doubling, raising questions about the Arctic’s
signal-to-noise ratio in change detection.
They established a website at
which they show the outputs of model runs done on various General Circulation Models
(GCMs). Unfortunately, the web pages showing the results for the various scenarios from a
number of sources take an enormously large amount of time to be displayed. The GIF
files (>500kB each, bringing the total data-transfer requirement for one HTML page to
more than 10MB) that they show collectively on each page were not downscaled to be
adjusted to the image size required for the thumbnail versions that they use as an index
to the larger version of the files. A somewhat more conveniently formated version of
one of their webpages showing results of retrograde modelling for the 1961-1990 interval
is accessible here. What the outputs from the various models
show is that their calculations are at variance not only from one another but differ
widely from reality:
During the 1961-1990 interval the actual mean temperature for the Edmonton rural
area was 2.1°Celsius (3.6°C in the City of Edmonton). Reading the temperature
values as best as can be done from the various graphs, the various models indicate values
for the Edmonton area for the 1961-1990 interval of 6°C (NCAR), 0°C (GFDL), 4°C (CCC),
3°C (CSIRO), 1°C (DKRZ), 4°C (MPCI), 3°C (CCSR), and 3°C (HADCM3) respectively.
The actual average precipitation for the Edmonton region was about 1.3 mm/day
for the 1961-1990 interval. The various models show the average daily precipitation
for that interval to be 2.4 mm (NCAR), 2.3 mm (GFD), 2.4 mm (CCC), 2.2 mm (CSIRO), 2.3 mm
(DKRZ), 2.0 mm (MPCI), 2.5 mm (CCSR), and 2.3 mm (HADCM3) respectively.
Given that the products of all of the various model runs disagree to a
considerable extent on what the climate
trend actually was for the 1961-1990 interval for the Arctic, how can anyone trust any of the
predictions made by the GCMs of what the future will bring? One notable feature of
the collection of analyses is that it appears to contain nothing that was produced by
CRYSYS, and that may be a relatively good thing.
The researchers constructing and using the various GCMs are without a doubt doing an
admirable job of bringing the performance of their models closer to acceptable variations of
one another. Perhaps they may even succeed eventually. Will they be able to bring their models to the point where they
accurately reflect what the climate was? That remains to be seen. In the
meantime it would be wise for anyone to refrain from using the models for making
predictions, let alone publicizing those that anyone feels need to be made. It
would most certainly be extremely dumb to base global fiscal policies on the predictions
of models that are unable to reflect what the climate actually is let alone forecast
accurately what anyone wishes it to be.
John L. Daly wrote an essay in which he discusses most of the known
factors affecting the changes in the expanse and the thickness of the Arctic sea ice:
The Top of the World: Is the North Pole Turning to Water?
2 Feb 2001
Water at the North Pole was big news in August 2000. Was it just
another media scare story, or is the Arctic sea ice really disappearing? This report
details the whole issue of Arctic sea ice.
The essay discusses a wide range of input data types measured at many
Arctic locations and for much longer intervals than merely a small fraction of the last
century. The findings discussed and summarized by John Daly show that the current
expanse of the Arctic sea ice is close to the average of the last few decades and growing
somewhat, even though there may be some thinning of the ice due to ocean currents.
However, he cautions that,
both the extent and thickness of Arctic sea ice is certainly subject to
variation. But it would be a mistake to assume that a brief period during which the Arctic
is in a thinning cycle is anything more than that - a cycle.
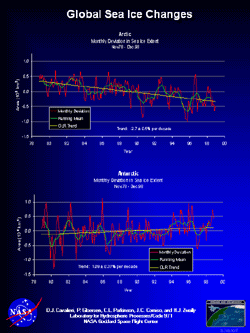
That the Antarctic is not warming and instead
has been cooling off somewhat during the interval since about 1970 would explain why
satellite observations of Antarctic sea ice show that it is increasing in area:
SATELLITES SHOW OVERALL
INCREASES IN ANTARCTIC SEA ICE COVER
By Krishna Ramanujan
Goddard Space Flight Center, Greenbelt, Md.
(Phone: 301/286-3026)
While recent studies have shown that
on the whole Arctic sea ice has decreased since the late 1970s, satellite records of sea
ice around Antarctica reveal an overall increase in the southern hemisphere ice over the
same period.
In a study just published in the
Annals of Glaciology, Claire Parkinson of NASA’s Goddard Space Flight Center analyzed
the length of the sea ice season throughout the Southern Ocean to obtain trends in sea ice
coverage. Parkinson examined 21 years (1979-1999) of Antarctic sea ice satellite records
and discovered that, on average, the area where southern sea ice seasons have lengthened
by at least one day per year is roughly twice as large as the area where sea ice seasons
have shortened by at least one day per year. One day per year equals three weeks over the
21-year period.
(Full
Story)
The calculations done by General Circulation Models (GCMs) are
the main source of the information that fuels the global warming hysteria.
Nevertheless, not one of them comes acceptably close to accurately calculating
what the climate presently is at any location, let alone of the whole Earth.
Not only that, but all of the GCMs differ widely from one another as to what the
climate was in the past, and as to what it is supposed to be in the future.
Therein lies the problem. No one in his right mind will base any decisions
about the future on tools that cannot determine with acceptable accuracy what
the present is and the past was.
_________________
What is
CRYSYS?
CRYSYS is a
specialist
research group studying snow and ice in Canada. It was initiated by scientists in 1988
and is a Canadian contribution to NASA's Earth Observing
System (EOS) Program. CRYSYS offers Canadian scientists opportunities to play a
significant role in developing methods for extracting information on the
cryosphere
from conventional and remote sensing systems. CRYSYS also provides Canadian scientists
with a link to the data and information system of EOS (EOSDIS), and allows CRYSYS
investigators access to the huge volumes of satellite data being archived under the EOS
program. In 1993, the Atmospheric Environment Service (now
Meteorological Service of Canada) of Environment
Canada took over the role of principal sponsoring agency for CRYSYS. CRYSYS involves over
30 researchers from 14 universities and 4 federal agencies. The name 'CRYSYS' is adapted
from its research goal 'to study variability and change of the Canadian CRYospheric
SYStem'.
The cryosphere is the portion of the world's climate system
which consists of snow and ice deposits, including ice sheets, ice caps, glaciers, sea
ice, seasonal or permanent snow cover, lake and river ice, permafrost and frozen ground.
(Source:
Definition
by CRYSYS)
|


