The solar constant isn't
constant. The sun is a variable star.
The vast majority of climate scientists in the world seriously
and objectively studies what it is that influences global climate changes. We don't
hear as much from them in the media as we do from the far smaller but also far more vocal
minority of climate scientists who make a living by publicizing alarmist and often
outrageous claims about man's detrimental influence on the global climate.
Armed with the very real evidence of the global cooling trend during the first half of the
20th century, climate alarmists claimed in the 1970s that another ice age was imminent.
Today they (including even some former proponents of a coming ice age, e. g.: Stephen Schneider),
ride a wave of alarm about man-made catastrophic global warming, a wave of alarm they
created and keep fueling .
Objective scientists find that the evidence supporting a man-made global warming trend is
at best skimpy. However, it cannot and should not be denied that climate changes
take place and that they have done so since long before man even made an appearance on
Earth.
Based on many different indicators from widely varying sources, it has been found that our
sun, a variable star, is a major and controlling influence on the extent and rate of long-
and short-term climate changes affecting Earth. In a January 17, 2003 article,
Science@NASA describes the extent of the fluctuations in solar radiation over time, how
they are being measured, the instruments that are being used to measure them, how those
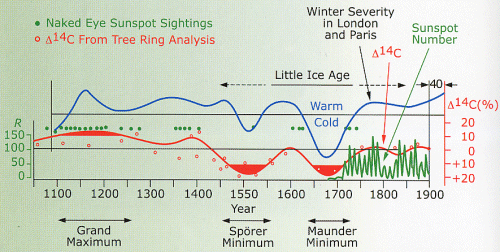
instruments are being calibrated and what has been found by using them.[1] The following graph is from
that article.

Above: Inferred variations in solar
intensity (red and green lines) over the last 900 years appear to be related to the
severity of winters in London and Paris. The red line is deduced from the abundance of a
heavy form of carbon (carbon-14) in tree rings. This "isotope" of carbon is
formed in the upper atmosphere when incoming cosmic rays smash into carbon dioxide
molecules. When the Sun's activity is low, its weakened magnetic field lets more cosmic
rays into the solar system, so carbon-14 abundances go up. (Notice on the graph that the
scale for carbon-14 is upside down.) This image by scientist John Eddy is based on an
earlier one that appeared in Science, 192, 1189 (1976).[1]
That appears to be ample evidence of variations in solar radiation, but it does not
explain what causes them. If the causes of the variations were to be determined and
if it were possible to use knowledge about them to predict the trends of the variations in
solar radiation, that would permit to forecast trends for climate change. Some
climate researchers are hard at work to do just that.
In his report, Solar Activity: A
Dominant Factor in Climate Dynamics, Dr. Theodor Landscheidt discusses that the
distance of the nucleus of the Sun from the center of the mass of the solar system varies
in an eleven-year cycle. The centre of the mass of the solar system is a function of
the distribution of the mass of the Sun and the planets, and as that distribution changes
as the planets orbit around the Sun, the distance between the nucleus of the Sun and the
center of the mass of the solar system is not constant and varies from one cycle to the
next. That causes variations in the rotational speed of the Sun. In turn, that
causes disturbances in the internal circulation of the Sun.
Those disturbances manifest themselves in the form of sunspots and solar
flares. It is primarily the intensity of solar flares and eruptions, not so much the
11-year sunspot cycle, that is of concern. Massive solar flares can be triggered and
occur even during or near the minimum of the 11-year sunspot cycle, and it can
happen that none or few of the sunspots detected during the peak of the 11-year sunspot
cycle are associated with very intense increases of solar radiation brought about by
massive solar flares or eruptions.
Depending on whether the nucleus of the Sun is closer or farther removed from the center
of mass of the solar system, and depending on the Sun's position in its oscillation around
that centre of mass, solar activity ranges from being virtually absent to being very
pronounced. During periods of high solar activity, the energy radiated by the Sun
increases, and therefore the Earth receives more radiation from the Sun and heats up.
Moreover, solar activities also interfere with the amount of cosmic radiation that
reaches the atmosphere of the Earth. Then there will be also a corresponding
reduction in cloud formation and therefore less precipitation. When the Sun has a
long interval of relatively large energy output, the Earth experiences global
warming. When the energy output by the Sun is low for an extended interval, the
Earth cools off. If such a quiet interval lasts for a very long time, the Earth
experiences an ice age.
The position of the Sun over time in relation to the center of mass of the solar system
can be calculated with great accuracy, both forward and backward in time and for many
years. It is therefore possible not only to correlate solar activity with attributes
of the climate in the past but also to predict to what extent solar activity will vary in
the future. Dr. Landscheidt related his calculations to some aspects of the weather
and accurately predicted three years in advance an end to the Sahelian drought (the end of
which brought hunger in Ethiopia to a close). He also predicted the devastating
flood in the Spring of 2001 (as well as others, that, he estimates, are still to come at
intervals of about 8.7 years, as they have been doing) in the River Po catch basin, Italy.
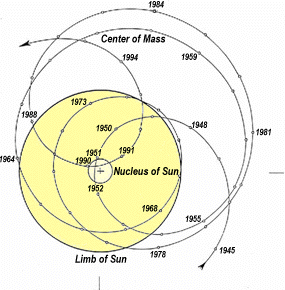
Figure 7

Most important [in the
prediction of global climate] are solar cycles which are without exception related to
the sun’s fundamental oscillation about the center of mass of the solar system and
form a fractal into which cycles of different length, but similar function are integrated.
The solar dynamo theory developed by H. Babcock, the first still rudimental theory of
sunspot activity, starts from the premise that the dynamics of the magnetic sunspot cycle
is driven by the sun’s rotation. Yet this theory only takes into account the
sun’s spin momentum, related to its rotation on its axis, but not its orbital angular
momentum linked to its very irregular oscillation about the center of mass of the solar
system (CM).
Figure 7 shows this fundamental motion, described by Newton [85]
three centuries ago. It is regulated by the distribution of the masses of the giant
planets Jupiter, Saturn, Uranus, and Neptune in space. The plot shows the relative
ecliptic positions of the center of mass (small circles) and the sun’s center (cross)
for the years 1945 to 1995 in a heliocentric coordinate system. The large solid circle
marks the sun’s surface. Most of the time, CM is to be found outside of the
sun’s body. Wide oscillations with distances up to 2.2 solar radii between the two
centers are followed by narrow orbits which may result in close encounters of the centers
as in 1951 and 1990. The contribution of the sun’s orbital angular momentum to its
total angular momentum is not negligible. It can reach 25% of the spin momentum [60].
The orbital angular momentum varies from -0.1 x 10 47 to 4.3 x 10 47 g cm 2 s -1 , or
reversely, which is more than a forty-fold increase or decrease. Thus it is conceivable
that these variations are related to varying phenomena in the sun’s activity,
especially if it is considered that the sun’s angular momentum plays an important
role in the dynamo theory of the sun’s magnetic activity.
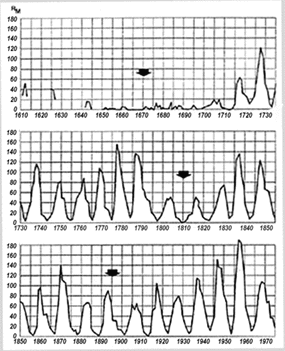
Figure 2

Modulation of the intensity of the 11-year sunspot cycle by
the 90-year Gleissberg-cycle, according to J. A. Eddy [17].
The arrows indicate the minima of the Gleissberg-cycle around 1670 (Maunder-Minimum), 1810
and 1895, which coincided with low points in global temperatures.
Figure 2 after J. A. Eddy [17] shows the strong
intensity variations in the 11-year sunspot cycle. When we connect the peaks by an
enveloping curve, minima in the Gleissberg cycle emerge around the years 1670 (Maunder
minimum), 1810, and 1895. They are marked by black arrows. Each of these secular sunspot
minima coincided with cool climate in the Northern Hemisphere. The deeper the level of
solar activity fell, the deeper sank the temperatures.
Quoted from: Solar Activity: A Dominant Factor in
Climate Dynamics, by Dr. Theodor Landscheidt, Schroeter Institute for Research in
Cycles of Solar Activity, Nova Scotia, Canada |
Dr. Tim Ball, a Canadian
climate scientist, says about the longer range of variations in solar
radiation:
At a presentation at the University of Victoria I stated that the
IPCC computer models do not include the Milankovitch Effect. A
person challenged this and said the models do include it. He was
confused because some models do include it, but not those used by
the IPCC. On a radio program Andrew Weaver, a lead author of the
computer model chapters in the IPCC Science Report called and said
it was not included because it was insignificant on a short time
scale. Figure 2 shows a plot of variations in the amount of solar
radiation at 65° north for a period of 1 million years.

Figure 2: Variations in the amount of insolation (incoming
solar radiation) at 65°N.
Source: BERGER, A. 1978. Long-term variations of daily
insolation and quaternary climatic changes. J. Atmos. Sci. 35:
2362–2367.
Range of variation is approximately 100 watts per square meter,
which far exceeds the 2 watts per square meter the IPCC attributes
to humans. ("Climate
Research Has Been Hampered by the IPCC and Governments for over
Twenty Years," by Dr. Tim Ball, Canada Free Press, Thursday,
September 30, 2010)
One of the main parties interested in making a living off
the man-made-global-warming hoax is Canada's federal government. It loves
"global-warming" because the public's acceptance of the hype constantly provides
new means to collect new taxes and to ram through its agenda for socialization and
world-income equalization, until we all are at the same level of poverty, or until the
Canadian economy collapses in ruins, whichever comes first.
The calculations done by General Circulation Models (GCMs) are
the main source of the information that fuels the global warming hysteria.
Nevertheless, not one of them comes acceptably close to accurately calculating
what the climate presently is at any location, let alone of the whole Earth.
Not only that, but all of the GCMs differ widely from one another as to what the
climate was in the past, and as to what it is supposed to be in the future.
Therein lies the problem. No one in his right mind will base any decisions
about the future on tools that cannot determine with acceptable accuracy what
the present is and the past was.
|


