Tree rings
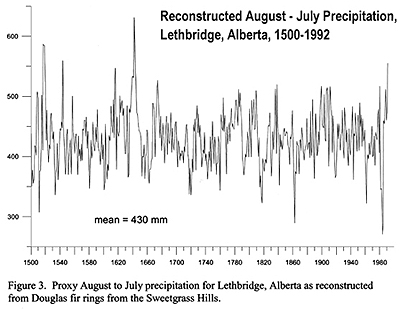
A continuous record has been established by examining, for example, tree rings (those
rings in wood that reflect the changing seasons of cold and drought, warmth and
precipitation during the life of a tree). By examining wood from trees of
different ages and from different time periods, a continuous record of climate changes can
be established that goes back a few thousand years.

Source: CLIMATIC VARIABILITY AND ITS IMPLICATIONS FOR
SUSTAINABLE AGRICULTURE,
D. J. Sauchyn, p. 16 8
Tree rings by themselves do not provide
accurate information on the temperatures under which they grew.
The thickness of tree rings depends on a combination of temperature and
precipitation. Tree rings don't grow during winter. However,
a carbon-14 analysis of carbon samples taken from tree rings that are
representative over time does give a fairly good representation of
levels of solar radiation received. Carbon-14 is an isotope of
carbon that is created by cosmic radiation in increased quantities from
nitrogen contained in the
atmosphere during intervals of low solar activity. High solar activity influences
the geo-magnetic field so that cosmic radiation is reduced. Those changing
intensities reflecting the activity of the sun over time are detectable in the carbon-14
content of tree rings.

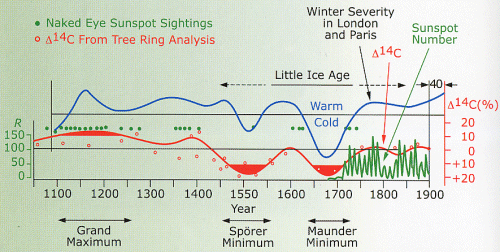
Above: Inferred variations in solar
intensity (red and green lines) over the last 900 years appear to be related to the
severity of winters in London and Paris. The red line is deduced from the abundance of a
heavy form of carbon (carbon-14) in tree rings. This "isotope" of carbon is
formed in the upper atmosphere when incoming cosmic rays smash into carbon dioxide
molecules. When the Sun's activity is low, its weakened magnetic field lets more cosmic
rays into the solar system, so carbon-14 abundances go up. (Notice on the graph that the
scale for carbon-14 is upside down.) This image by scientist John Eddy is based on an
earlier one that appeared in Science, 192, 1189 (1976).[1]
See also:
Five Hundred Years of Drought
and Wetness in the United States
Fye, F.K., Stahle, D.W. and Cook, E.R. 2003. Paleoclimatic analogs
to twentieth-century moisture regimes across the United States. Bulletin of the American Meteorological Society 84: 901-909.
Summary
by the Center for the Study of Carbon
Dioxide and Global Change (2003 10 01 )
What do they tell us about the highly-advertised claims of the
world's climate alarmists relative to warming-induced droughts and
floods?....
Climate alarmists claim that global warming will bring extremes
of both floods and droughts to the world, and that the earth is now
warmer than it has been in the entire past millennium. If these two
claims were correct, we should clearly be seeing wet and dry periods
that exceed the worst of the past half-millennium or more. In this
extensive and well-calibrated record from the United States, however, we
don't. Ergo, something is rotten in more than Denmark.
Full
Story
There is additional evidence, such as the results of examining
sedimentary records in lake beds. Those layers of sedimentation permit to identify
the seasonal fluctuations in the run-off as well as the total amount of run-off and the
historical water levels in our lakes.6
Similarly, sedimentation records obtained by examining core samples taken
from the sea beds of various oceans permit to establish quite accurately what life existed
at the ocean surface and how well it did over the centuries and millennia. Thereby a
continuous and accurate record of historical surface
sea-temperatures can be determined.
Curiously, and the Kyoto-hype advocates must surely be interested in that (or
are they?), the record for the Sargasso Sea shows that the current sea-surface temperature
is about half a degree Celsius below the average for the last 3000 years. Moreover,
although the sea-surface temperature has recently increased somewhat but not quite reached
the 3000-year average, it is rising in perfect synchronicity with the record of solar
activity. It has done so before and will do so again.
Just as there were times in the past where it was much colder than it is now,
so there were times when our globe was much warmer. The last period of a
considerably warmer climate was during the Medieval Optimum, just before the Little Ice
Age set in out of which we are climbing just now.
Superstitions, in spite of many voices of reason, brought about the witch
hunts as the climate turned colder during the Little Ice Age. (See the paper by historian
Wolfgang Behringer:
Climatic
Change and Witch-Hunting: The Impact of the Little Ice Age on Mentalities)
Superstitions, in spite of many voices of reason, bring us now the witch
hunts promoted by the proponents of the Kyoto accord. Such is the power of
propaganda.
The calculations done by General Circulation Models (GCMs) are
the main source of the information that fuels the global warming hysteria.
Nevertheless, not one of them comes acceptably close to accurately calculating
what the climate presently is at any location, let alone of the whole Earth.
Not only that, but all of the GCMs differ widely from one another as to what the
climate was in the past, and as to what it is supposed to be in the future.
Therein lies the problem. No one in his right mind will base any decisions
about the future on tools that cannot determine with acceptable accuracy what
the present is and the past was.
_______________
See also:
Medieval Warm Period
(Solar Influence) – Summary, by the Center for the Study of Carbon Dioxide
and Global Change (2003 01 29)
Medieval Warm Period Project, a comprehensive collection of
references to studies of proxy climate records throughout the world, by
CO2 Science (formerly the Center for the Study of
Carbon Dioxide and Global Change)
|


