If
greenhouse gases are bad, how come rising CO2 levels increase agricultural productivity?
What about greenhouse gases? Plenty of evidence from numerous studies
indicates that the Earth has far more capacity to absorb greenhouse gases than
the IPCC gives it
credit for, many times more, and that additional CO2 will actually be
beneficial to farming, both in the quantity and the quality of crops that can be raised.
Dr. Landscheidt identified in his report that the atmospheric CO2
concentrations appear to follow with a six month time lag variations in solar activity and
corresponding temperature variations. That would indicate that increases in CO2
concentration are caused by atmospheric warming resulting from solar activity, not that
increases in the CO2 content of the atmosphere cause warming (or the heating-up
of the sun). With warmer weather the sea water warms up. When that happens, CO2
is released by the sea water.
Try it
sometimes with two glasses of pop. Put one in a pot of water and
warm it up a bit. Put the other in the fridge. When the pop
in the warm water bath has no more fizz left, check the one in the
fridge to see whether it still has any. Moreover, when the climate
warms up, plants absorb more CO2, grow better and therefore
produce more oxygen.
However, none of that matters to the IPCC, Suzuki and cohorts. Never mind that in
the past, CO2 levels in the atmosphere have at times been 20 times
or more than what they
are now. That those levels were much higher than now is a good thing, or else we would not have any coal to burn now, most likely
no oil either. Would that be good? Maybe, if we want to return to the way of
life our great-grandparents led. Then we would have to walk through the
horse manure in the streets to pick up a pint or so of whale oil for our lamps, instead of
ducking from the horse manure that is being launched at us with the help of the media, both
in print and on TV.
The Fraser Institute's Global Warming — A Guide to the Science shows
"that current estimates from climate models of global temperature changes owing to
increased concentration of atmospheric CO2 remain highly uncertain."10
The calculations done by General Circulation Models (GCMs) are
the main source of the information that fuels the global warming hysteria.
Nevertheless, not one of them comes acceptably close to accurately calculating
what the climate presently is at any location, let alone of the whole Earth.
Not only that, but all of the GCMs differ widely from one another as to what the
climate was in the past, and as to what it is supposed to be in the future.
Therein lies the problem. No one in his right mind will base any decisions
about the future on tools that cannot determine with acceptable accuracy what
the present is and the past was.
Nigel Calder is one of many reputable climatologists who try to
counter the loud voices of snake-oil salesmen who are far less qualified to utter sensible
opinions about climate trends. He demonstrated that "The Sun sets the level of
carbon dioxide in the Earth's atmosphere by the cumulative effect of variations in the
galactic cosmic rays reaching the Earth, as modulated by the variable solar wind."(11)
As Nigel Calder explained and proved, during periods of high solar activity the resulting
increases in the solar wind modulate the magnetic field enveloping the Earth. As a
result of that not only does the Earth receive more radiation from the Sun
during periods of high solar activity but also
increased cosmic radiation during periods of low solar activity. Increases
in solar radiation
cause CO2 levels on Earth to rise. Therefore it is global
warming that causes CO2 to rise, not the converse, while
decreases in solar radiation cause increases in cosmic radiation that
impinges on Earth, ionizing some atmospheric gas molecules, thereby
providing more condensation kernels that cause increases in cloud cover
and therefore greater reflectivity of the Earth atmosphere and general
cooling, reducing the amount of CO2 released into the
atmosphere.(11)
It is no accident that the geological record shows that all ice ages
happened during periods of low solar activity, while the intermediate
warmer periods between ice ages happened during periods of high solar
activity.
There is another, far more serious issue with the measuring of CO2
levels in proxy records, such as the measuring of CO2 content
in bubbles trapped in glacier ice cores. Not only do such
measurements become confounded by serious and insurmountable technical
obstacles, but according to Prof. Zbigniew Jaworowski the results of
such measurements were seriously fudged by some scientists that obtained
or used them, so as to fit measurements of historical CO2
levels in proxy records to the theory required to support the global
warming ideology. See:
Statement written for the Hearing before the US Senate Committee
on Commerce, Science, and Transportation:
Climate Change:
Incorrect information on pre-industrial CO2
March 19, 2004
Statement of Prof. Zbigniew Jaworowski
Chairman, Scientific Council of Central Laboratory for Radiological
Protection, Warsaw, Poland
Quoted from that statement:
The notion of low pre-industrial CO2 atmospheric level, based
on such poor knowledge, became a widely accepted Holy Grail of
climate warming models. The modelers ignored the evidence from
direct measurements of CO2 in atmospheric air indicating that in
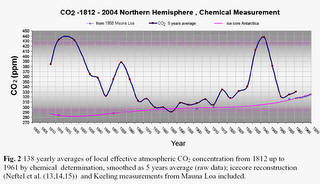
19th century its average concentration was 335 ppmv[11] (Figure 2). In Figure 2 encircled values show a biased
selection of data used to demonstrate that in 19th century
atmosphere the CO2 level was 292 ppmv[12]. A study of stomatal
frequency in fossil leaves from Holocene lake deposits in
Denmark, showing that 9400 years ago CO2 atmospheric level was
333 ppmv, and 9600 years ago 348 ppmv, falsify the concept of
stabilized and low CO2 air concentration until the advent of
industrial revolution [13].
The March 19, 2007 statement by Dr. Zbigniew Jaworowsky was expanded by
him in an article titled "CO2: The Greatest Scientific
Scandal of Our Time" (Spring/Summer 2007, pp.14 - 28, 21st CENTURY
Science & Technology;
444 kB PDF file).
That article contains a reference (short version) to Dipl. Biol.
Ernst-George Beck's report on "180
YEARS OF ATMOSPHERIC CO2
GAS ANALYSIS BY CHEMICAL METHODS" published by
Energy & Environment
(Vol 18 No. 2 2007), comparing "90,000 accurate chemical analyses of CO2
levels in the air recorded from 1812 through 1961. This record shows a
remarkedly different trend compared to the literature of UN's
International Panel on Climate Change (IPCC)." (Abstract: Sunday, March
25, 2007,
Beck's 138 year-long record of atmospheric CO2)
The report (short version) by Ernst-George Beck presents the
following comparison between actual measurements of atmospheric CO2
levels and the values presented by the IPCC.
(Click on image to see full-resolution graph)
Note: Ferdinand Engelbeen has
justified and somewhat serious reservations about the compilation by
Ernst Beck. He argues that in all likelihood only the
minimum values compiled by Ernst Beck should have been used and that
those do not vary much from the values measured in ice cores.
___________________
See also:
Data
categories:
|